7 Must-Have KPI Dashboards to Maximise Expo ROI
7 Must-Have KPI Dashboards to Maximise Expo ROI
Explore Corporate Gifting
Key Takeaways
-
KPI dashboards are essential for tracking every aspect of your trade show performance—from footfall to follow-ups to final conversions.
-
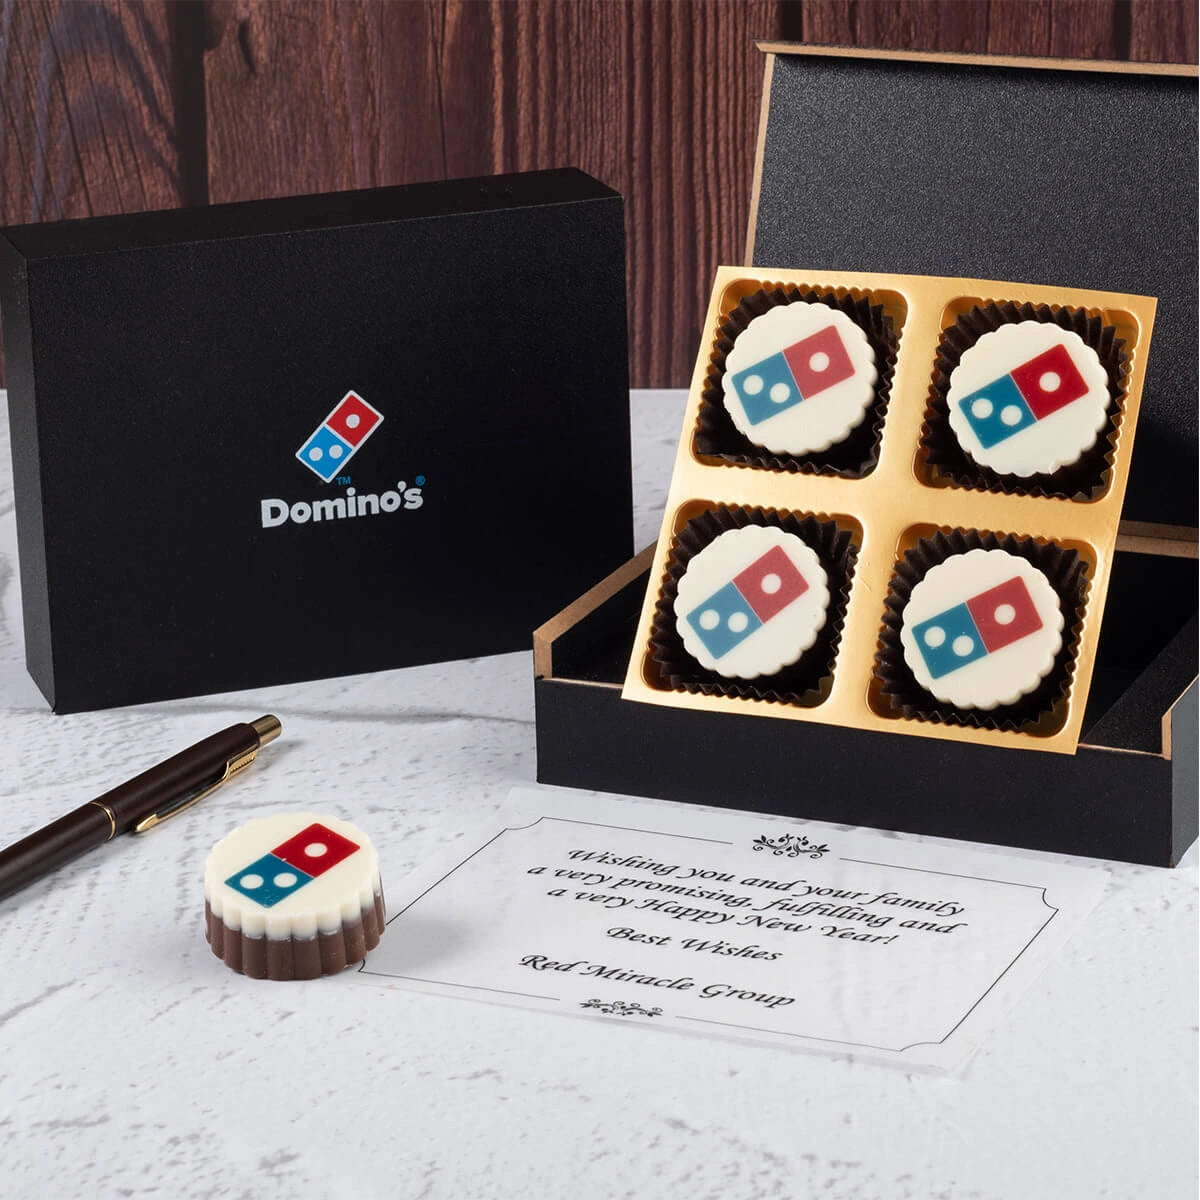
Gifting analytics, especially with branded items like ChocoCraft’s printed chocolates, can help measure recall, engagement, and emotional impact more effectively than generic giveaways.
-
Real-time dashboards ensure event marketers don’t just rely on intuition—they work with data to justify budgets and optimise future exhibitions.
-
Tools like the Expo Giveaway ROI Calculator simplify complex ROI calculations and should be a staple in every event strategy.
-
Integrating dashboards into your marketing tech stack, whether through CRM or standalone analytics platforms, creates a seamless feedback loop for continuous improvement.
In today’s data-driven marketing landscape, walking away from an expo or trade show without hard performance metrics is like flying blind. For HR managers, marketing heads, admin leaders, or CXOs, a booth isn't just a branding exercise—it’s a performance lab. That’s why understanding which expo KPI dashboards to use can mean the difference between vague impressions and actionable insights.
Whether you're launching a new product, networking for B2B partnerships, or distributing corporate gifts like branded chocolates to drive booth engagement, real-time data visualisation through KPI dashboards ensures your team stays aligned with campaign goals.
And here’s the good news: With platforms like ChocoCraft, even something as tactile as gifting can become trackable, measurable, and ROI-focused.
-----------------------------------------------------------------------------
1. The Lead Funnel Dashboard
Let’s start with the holy grail: leads. A lead funnel dashboard tracks how many leads were generated, their quality score, source, and movement through your sales pipeline. This dashboard is critical for both B2B expos and recruitment fairs, especially when gift-driven engagement is in play.
Key Metrics:
- Number of leads collected
- Lead source (walk-in, referral, QR code scan, social)
- Qualification score
- Follow-up status
Pro Tip: Use QR codes on your giveaway items to auto-capture and qualify leads.
Build a gifting experience—combine logo chocolates with festive hampers for maximum impact. Read more →
-----------------------------------------------------------------------------
2. Booth Traffic & Engagement Dashboard
This dashboard tells you who came, how long they stayed, and what they interacted with. It’s essential for optimizing booth layout and engagement activities.
Key Metrics:
- Total footfall
- Average dwell time
- Heatmap of booth areas visited
- Engagement actions (games played, demos watched, QR code scans)
Using event marketing KPIs like these helps fine-tune your booth design for future expos.
Real Example: A ChocoCraft client added a chocolate engraving station at their stall. Paired with heatmap tracking, it showed 3x more dwell time than other booth zones.
Premium Corporate Gifts with Logo Chocolates
Make a lasting impression on clients and employees with personalized chocolate gift boxes that reflect your brand.
Explore Now-----------------------------------------------------------------------------
3. ROI & Cost Efficiency Dashboard
If you can’t justify your spend, it’s hard to secure bigger budgets next year. This dashboard compares investment with outcomes.
Key Metrics:
- Total spend (stall, travel, staffing, gifts)
- Cost per lead
- Cost per qualified lead
- Total estimated ROI
Read our Expo ROI Calculator blog to learn how to forecast and compare different spend scenarios.
-----------------------------------------------------------------------------
4. Social Media & Digital Buzz Dashboard
Event success isn’t just what happens at the stall; it’s what gets amplified online. This dashboard tracks your brand’s digital footprint during and after the event.
Key Metrics:
- Hashtag usage and reach
- Brand mentions across platforms
- Influencer activity
- UGC (User Generated Content) count
Want to multiply reach? Our clients often add branded QR codes to custom chocolate boxes that link to a campaign or survey landing page.
-----------------------------------------------------------------------------
5. Staff Performance Dashboard
Behind every lead is a booth rep. This dashboard monitors staff effectiveness and identifies top performers.
Key Metrics:
- Interactions per staff member
- Leads entered per shift
- Conversion to follow-up
- Customer satisfaction rating (if collected on-site)
Tip: Use a simple staff scoring system tied to digital lead forms for fairness and accuracy.
-----------------------------------------------------------------------------
6. Brand Recall & Sentiment Dashboard
Six months post-expo, what do your prospects remember? This dashboard ties in with long-term marketing strategy.
Key Metrics:
- Brand name recall (survey-based)
- Net Promoter Score (NPS)
- Sentiment analysis from feedback
- Repeat interaction rate
Check out our blog on measuring long-term brand recall through gifting to see how this works.
Custom Gifting Analytics Dashboard
Corporate gifts aren’t just about delight—they’re data touchpoints. With a Custom Gifting Analytics Dashboard, you can track how well your giveaway strategy is performing, especially when using branded, interactive gifts like ChocoCraft’s printed chocolates.
These dashboards help measure the impact of tactile experiences that bridge the online and offline worlds—perfect for gifting ROI in expos or corporate celebrations.
Key Metrics:
-
Gift redemption rates
-
QR code scans from gift boxes
-
Landing page visits tied to gift campaigns
-
Social media shares of branded gifts
-
Feedback submitted via gifting triggers (e.g., survey on unboxing)
Example in Action:
A fintech company using ChocoCraft’s 4-piece chocolate boxes at an IT summit integrated unique QR codes inside each box lid. The campaign resulted in a 27% scan rate and a 9% lead conversion, directly trackable via the dashboard.
Why It Works:
Memorable gifts lead to higher recall and engagement. When paired with smart tracking tools, you’re not just giving—you’re gaining data, insights, and long-term brand affinity.
Make gifting part of your analytics conversation. As part of employee engagement through gifting, it adds both value and measurability to your campaign.
Focus on gifts that strengthen engagement: personalized chocolates boost brand recall and retention. Read more →
-----------------------------------------------------------------------------
7. Conversion Dashboard (Post-Event Follow-Up)
Here’s where the rubber meets the road. How many leads turned into clients or partners?
Key Metrics:
- Email open & click-through rates
- Meetings booked post-expo
- Deals closed (volume and value)
- Sales cycle duration
Stat: According to Forrester, B2B brands that follow up within 24 hours are 60% more likely to convert expo leads.
Premium Corporate Gift Box
Stylish and elegant chocolate boxes crafted to leave a lasting impression on your clients.
Explore Now
-----------------------------------------------------------------------------
Bonus: Tools & Tips for Better Dashboards
Tools:
- Google Data Studio (free, easy to use)
- Zoho Analytics (Indian business-friendly)
- Power BI (for larger teams)
Tips:
- Map KPIs to specific campaign goals
- Keep dashboards visually simple
- Automate data feeds where possible
- Use filters to slice data by day, product, or staff
-----------------------------------------------------------------------------
Common Dashboard Mistakes to Avoid
Even with the right tools, dashboards can fall flat if executed poorly. Here are common pitfalls marketers make—and how to avoid them.
1. Tracking too many KPIs:
More isn’t always better. Focus on KPIs that align directly with campaign goals. Too many metrics dilute insights and confuse stakeholders.
2. Ignoring visual clarity:
Cluttered dashboards confuse more than they clarify. Use clean charts, limit color use, and label everything. Less dashboard noise = more clarity.
3. Manual data input:
Manually updating dashboards invites errors and wastes time. Integrate your CRM or marketing automation tools to streamline inputs.
4. No follow-up action:
Dashboards are useless if you don’t act on the insights. Always assign owners to key metrics, and schedule weekly reviews post-event.
5. Skipping staff training:
Dashboards should be universally understood, not locked behind one analyst. Make dashboard literacy part of your marketing team’s upskilling.
Pro Tip:
Create dashboard templates for repeated events—like expos, corporate gifting campaigns, or product launches. This ensures consistency and accelerates analysis.
Avoid these pitfalls to ensure your expo KPI dashboards become drivers of real growth, not just decoration on your marketing reports.
-----------------------------------------------------------------------------
How ChocoCraft Makes Event Gifting Trackable
ChocoCraft is a leader in customised chocolate gifting in India. Our printed chocolates, presented in elegant, brandable boxes, are a proven attention magnet at expos.
But we take it further:
- Add QR codes or custom landing pages to chocolate packaging
- Track scans, visits, or downloads
- Measure offline gifting’s digital impact
From 2-piece boxes to 18-piece premium boxes, everything can be integrated into your event analytics dashboard.
Select an agency that offers full customization, mockup previews, and reliable delivery. Read more →
-----------------------------------------------------------------------------
Related Reads from ChocoCraft
- Pre-Diwali Occasions: Tiered Gifting Strategies
- Navratri to Diwali: Corporate Gifting Plan 2025
- Festival Celebrations at Work: Gifting Before Diwali
- Durga Puja Gifting Ideas for Employees
- Personalized Diwali Gifts for Employees
- Top 10 Budget Diwali Gifts Under ₹700
- Modern Diwali Gifts for Employees 2025
- Bulk Diwali Gifting for Employees: Checklist
- Diwali Gift Etiquette for Employees
-----------------------------------------------------------------------------
Turning Insights into Next Year’s Strategy
Dashboards are more than post-event wrap-up tools—they’re strategic assets for your next exhibition cycle.
Here’s how to use your dashboards for future planning:
-
Booth Design Optimization:
Use heatmaps and dwell time data to redesign booth layouts. What worked? What didn’t? Let the numbers decide. -
Gift Strategy Evolution:
If a specific gift triggered higher scan rates or engagement, double down. With ChocoCraft's variety—like 6-piece chocolate boxes—you can tailor gifts to segment-specific preferences. -
Better Staff Allocation:
Was one staffer consistently outperforming others? Use that insight to train and replicate winning behaviors. -
Smarter Budgeting:
Using ROI dashboards, cut low-performing tactics and reinvest in high-yield strategies. This means data-backed budget proposals that get approved faster.
Example:
One ChocoCraft client used gifting conversion data from a 2024 expo to convince leadership to increase their 2025 giveaway budget by 30%. Their logic? The previous year’s data proved the ROI.
In short: Your dashboard should become your event playbook. Don’t archive it—activate it.
4 Piece Premium Client Gift Box
A compact yet elegant chocolate box designed for exclusive corporate gifting.
See Collection-----------------------------------------------------------------------------
Final Thoughts: Make Your Data Work as Hard as You Do
Trade shows are intense—weeks of planning, budgets, logistics, travel, and hustle. Don’t let the insights slip through the cracks. With the right expo KPI dashboard, you can turn every handshake, every gift, and every conversation into quantifiable outcomes.
Let data guide your strategy, not guesswork. Whether you’re choosing the perfect corporate gift, launching a new product, or nurturing key accounts, analytics best practices make your brand smarter, sharper, and more memorable.
And with ChocoCraft, even your chocolates can speak volumes—and generate clicks.
Looking to impress at your next event? Explore our full corporate gifting range and make your expo experience not just sweet, but smart.
Also explore: New Year & Christmas Gifts for Corporates
-----------------------------------------------------------------------------
Key Information
| KPI Dashboard | Purpose | Key Metrics Tracked |
|---|---|---|
| Lead Generation Dashboard | Track how many leads are generated from the expo | New leads, lead source, booth traffic, scan-to-conversion ratio |
| Engagement Analytics Dashboard | Understand how visitors interact with your booth | Dwell time, product demos attended, interaction hotspots |
| Sales Pipeline Dashboard | Monitor post-expo lead progression into sales funnel | Deal stage movement, value per lead, follow-up timelines |
| ROI Calculator Dashboard | Quantify your return on investment from the expo | Total cost vs revenue, cost per lead, lifetime value of acquired clients |
| Gifting Impact Dashboard | Track effect of giveaways on engagement and brand recall | Redemption rate, QR scan data, recall surveys, gifting-to-lead conversion |
| Social & Digital Footprint Tracker | Measure your digital impact during and after the event | Hashtag use, impressions, engagement rates, influencer mentions |
| Post-Event Feedback Dashboard | Understand attendee experience and gather improvement insights | NPS score, feedback forms, suggestion trends, booth rating |
FAQs
-
What is an expo KPI dashboard?
An expo KPI dashboard is a visual analytics tool that consolidates all key performance metrics from a trade show or expo in one place—helping marketers quickly assess success and areas for improvement. -
Which KPIs are critical for trade shows?
Key trade show KPIs include lead count, cost per lead, footfall, engagement time, conversion rate, social media reach, and post-event NPS. -
Can small businesses afford analytics dashboards?
Yes. Tools like Google Data Studio and Zoho Analytics offer free or affordable plans perfect for small to medium businesses tracking basic event KPIs. -
Why is tracking ROI from expos important?
Tracking ROI helps justify the marketing spend, improves budgeting for future events, and ensures better targeting and messaging strategies. -
How do I track offline gifting impact at expos?
Use QR codes or custom URLs on gifts (like ChocoCraft's chocolate boxes) that link to campaign landing pages to track engagement and conversions. -
What’s the best way to visualize event data?
Use bar graphs for comparison, heatmaps for engagement zones, and funnel charts for lead progression. Clarity and simplicity are key. -
Is footfall a reliable metric alone?
Not really. Footfall needs to be paired with dwell time, engagement, and lead conversion data to provide actionable insights. -
Can staff performance be measured at expos?
Yes. You can track interactions per staff, lead input accuracy, speed of data entry, and follow-up effectiveness post-event. -
How soon should data be reviewed after an event?
Within 72 hours is ideal. Early review enables timely follow-up, realignment of sales outreach, and fast decision-making. -
Are expo dashboards useful for client presentations?
Absolutely. Visual KPIs help communicate value to stakeholders and justify future participation in similar events.
